

Battle:
Homey versus Homey PRO
Performance test:
To measure the speed difference between the normal version and the PRO version, I devised 5 different test procedures. Before we dive into this, it is good to have the basic principles clear. Below you will find the specifications of the used Homey's:
System with load (full Homey):
APPS:
- Aqara & Xiaomi
- Beacon
- Brel motors
- Outdoor radar
- CountDown
- Danalock
- Enelogic and Youless
- Eurotronic
- Fibaro
- Greenwave Systems
- Heiman
- Homey Harmony Hub
- IFTTT
- Neo Coolcam
- Nest
- Pushover
- Simple log
- Virtual Appliances
- Solar panels
So 21 APPS in total.
Devices:
- Aqara (zigbee): 21 pcs
- BT: 3 BT trackers
- Brel: 1x curtains (433Mhz)
- Danalock: 1x Danalock v3
- Youless: 2 meters
- Fibaro: 37 pieces
- Greenwave: 3 pcs
- Heiman: 5 pcs
- Harmony: 1 hub
- Nest: 1x thermostat, 2x smoke detector, 1 Hello, 1x indoor cam
- Neo Coolcam: 21 pcs
- Zipato: 9 pcs
- Solar panels: 1 Omnik
So a total of 110 devices. I did not count the end points (temperature sensors, moisture meters, etc.) but these are over 150 pieces.
Flows:
- 212 flows
These flows of course not all run at the same time, but a lot of them run continuously to check values.
The tests I have done are on the above installation of APPs/devices /flows as well as with a new empty Homey. This also applies to the PRO version, so I also tested it "empty" and "full".
System no load (empty Homey):
APPS:
- Neo coolcam
So in total 1 APP.
Devices:
- Neo Coolcam
So in total 1 device.
Flows:
- 1 flow
The above configurations are to show a system that is under load and a system that is under low load. Finally I want to report that I measured both after a reboot and at different times after this reboot.
Measurement method:
I measured this with a stopwatch, but because this sometimes goes to 1/100th of a second, this is a bit difficult. That is why I also recorded the times and recalculated/viewed this via the computer.
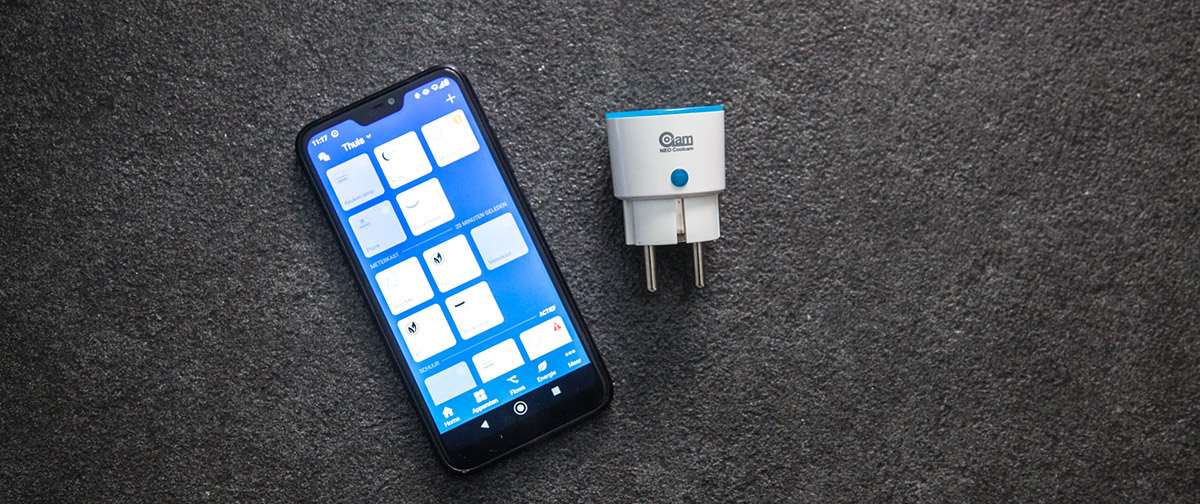
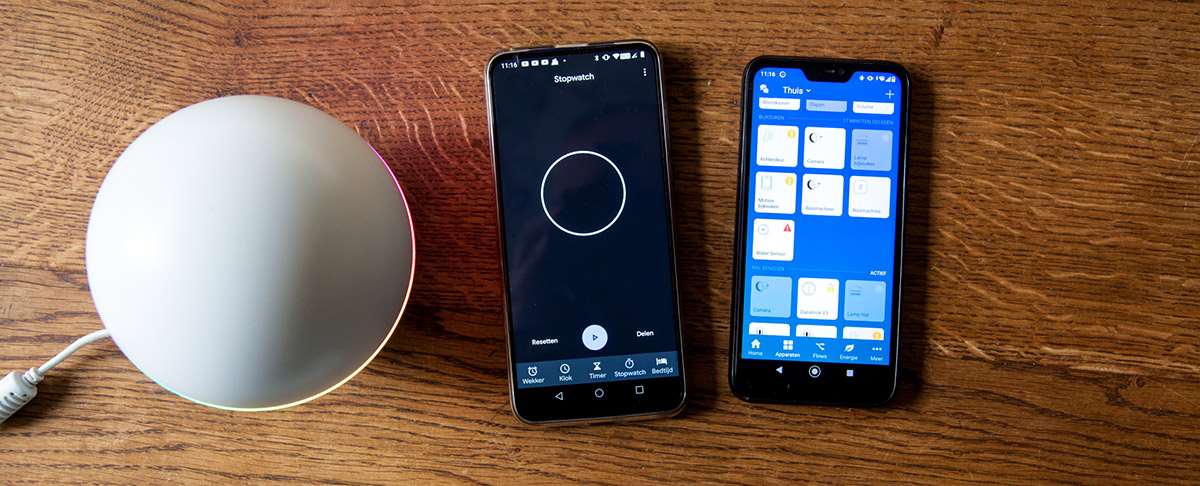
1) Response time Z-Wave:
To see if the response time between the Homey and Homey PRO is different, I use a Neo Coolcam. Good to report is that it communicates directly with the controller. I have tested at different times, this to rule out congestion on the network.
The difference between an empty Homey and an empty Homey Pro is not too big, but the difference with a full one is really huge. You can clearly see that the normal Homey was still busy and therefore could not handle the traffic in a fast way.
2) Test with flow:
What is particularly striking is that the Homey has difficulty performing a flow in which many devices have to be switched on at the same time. So I made a flow where 6 devices are turned on. These are the following devices:
1x Fibaro Dimmer 2
1x Fibaro RGBW
1x Fibaro Relay Switch 2
1x Neo Coolcam Power plug
3x Greenwave power plug
I measure the time when starting the flow until the APP indicates that everything is on.
The difference between the normal Homey and the Pro is not that big here (0.2 seconds).
3) Open flow:
The next test is to open a flow. You would think that opening a flow should not cause performance problems. Well, I have a few flows that load difficult in the normal version. This flow consists of 11 cards. Where 5 cards have to start a different flow. Obviously, this requires some computing power to find these (especially if you have more than 50 flows that can be selected).
Here too you see that the PRO is again the faster. It saves almost 1 second with the normal version.
4) General item:
To test the local speed, I looked for something that really requires something from the controller. I found this in the "General" section. You can find this in the settings.
In addition to some general information, this page also requests memory usage and storage.
<p
As expected, the PRO is also faster here. It saves almost 4 seconds.
5) Reboot:
The penultimate test is to see how fast the system boots. I stop the stopwatch when all devices and APPs have been loaded.
Here you also see that the PRO starts up faster. There is almost 2 minutes between the fastest time and the slowest time.
6) System load:
During the last test I looked at the load on the system at fixed times. This test is a bit tricky because something can happen at that moment. That's why I tracked the tax at 9 different times for 5 days. The table below shows the average values.
Not very surprising, but here you also find that everything is less taxed.